Get Louder!
an advokit for libraries
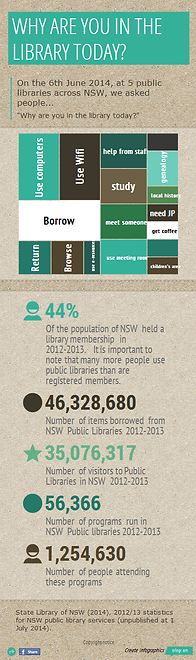
Info.gram
Audience: This site seems more suitable for professionals and adults though students would be able to use it as well. Templates are fairly easy to modify.
About: This will help you create professional infographics however has limited templates for you to use in the free version and you will need to create an account to use it. There are more than 30 charts types for you to choose from and it uses a spreadsheet function to edit data or you can import your own spreadsheet data. You can upload you own pictures, add video, charts, and text to our infographic to help tell your story. The text function has options on the type of text you are adding such as Headline, Chart title, quote, body text, and facts & figures to help you with formatting.
Cost: Free version available
Share options: Infographics you create are automatically saved into a library file from where you can save to your computer. You can also share your infographic by using the share button and make your infographic public. The infogram logo will remain on your infographic and there is a copyright notice.

Wordle
Audience: Can easily be used by children or adults.
About: Wordle is super easy to use. You can create word clouds by either typing, or (more simply), by copying and pasting text into the dialogue box and pressing “go”. It is then very easy to change the font or the shape from a drop down menu. Wordle offers preselected colour palettes, or the option to select colours, again, very easy. The now familiar cloud style should be relatively easy for most users to recognise, with the more popular word being bigger, while the less used ones in the text appearing smaller. The resulting images can be busy looking, and, being words not pictograms, may still require a little time to fully absorb. They could easily and effectively be used to give an overview of library services, or to highlight disparity between the most and least popular of a range of options. Wordle requires Java, which can cause some problems with Chrome, for example, Mac users cannot use Chrome to create or view Wordles. Users are free to use the graphic created in any way they choose, and even to earn profit from it. If it is published publicly, then anyone can access it for free. Worldes are not, however searchable.
Cost: Free, with no registration required to use Wordle.
Share options: Worldle differs from many other infographic sites, in that it does not offer to share your creation via social media. You can open in a separate window and save as a PDF, or take a screenshot of your image. Users are offerd a URL once the graphic is shared publicly, and reminds you that you will only get one chance to copy down the link. You also get the option to delete at this stage.
Time taken to make: 5-10 minutes. Seriously, it’s that easy to use.

Venngage
About: Venngage offers a variety of templates, which look good and are relatively easy to modify. The style of these templates is more towards the complex end of the infographics scale, in that there are several tiers of visual data to fill per page. These could easily be streamlined if you want. There are nearly 30 free templates, a handful to pay $5.00 US for, and another handful only accessible to the premium service. You also have the option of creating your own infographics from scratch using the charts and pictograms provided, or images you upload, or find on the web. When you are beginning to make your infographic, don’t be put off by the “shopping cart” pictogram over the market place, the free templates are in there too. The user has more freedom to alter font, formatting, colour, location of objects on the page than on some other sites. There is also a larger range of basic pictograms and graph types than some other sites. The page sizes offered are more familiar for those accustomed to print, in that it offers A4, A5, broadsheet, legal, landscape and profile etc, not mobile, or the size of the image in pixels.
Venngage does not support Internet Explorer, so try Chrome, or Firefox.
Share options: Social media site include Facebook, Twitter, Google +, Reddit, Linkedin and Tumblr. Venngage also supply a URL for you to share and an embedding code to put into a website, or wiki. In paid versions of Venngage there is also an option to export the image as either PDF of PNG.
Cost: Free account available. Premium account is $19 US per month. You will be unable to make any infographics using Venngage without signing up.
Time taken to make: 45 mins for the first one. Could make it more quickly after that with practice.
Infographics
Infographics have become a very popular way of presenting information. Infographics visualize information, data or knowledge in a quick and easy to understand way. A well designed infographic can be a powerful tool when conveying a message and can therefore be very valuable for advocacy, marketing and promotion for libraries.
Infographics are fun and easy to create and you can easily embed them in reports, blogs or share them on social media sites. On this page you will find reviews of some useful infographic creator sites. If the design aspect daunts you, most of the infographic creator sites provide ready-made templates which are easily customised. Have fun!
Infographic creator sites and apps

Easel.ly
About: Easel.ly infographic site is free to use and can help you create some interesting basic infographics in a very short amount of time and can be used by students and professionals or any individual. You do not have to create an account to use this site though it does only offer very limited graphics and themes you will only be able to download your graphic to save it if you don’t. Downloading is simple and has three options low Quality, high quality or PDF. Creating an account is also free and offers a few more graphics and themes to use. You can use a themed template or be creative and create your own infographic from scratch. When creating your own infographic it uses the drag and drop technique and has an easy to use grid feature which helps you to position objects and text on your page to help keep your infographic uniform. You can resize objects easily by clicking on them. It has a very basic colour palette to help you change object colour.
Cost: Free accounts available.
Share options: If you create an account you can save your infographic and edit it later and share.

iVisual info Touch - app for IPad
About: Ivisual Info Touch is a great App that can be used on an IPad for creating infographics.
The app is very user freindly and can be used by both students and adults.
There are no templates so you need to make your own from scratch however as this program is simple to use they can be made up in minutes. You can pick your background colour , add text, make charts and also quickly upload photos to be used in the infographic from your ipad.
Cost: $3.97 for the full version or there is an iVisual Info Touch Light version which is free for those libraries that want to sample the program before buying the full version.
Share options: The program can be created and then easily shared to Facebook, Twitter, Youtube and Email with the touch of a button.
Star rating:
Star rating:
Star rating:
Star rating:
Star rating:
1/2

